2020 New Construction Sales Statistics - Symphony Ranch

From February 1 through February 7, 2021, I will be posting 2020 sales data for each ongoing new construction subdivision in the Reno/Sparks market. This information is extracted from data published by the Washoe County Assessor. The square footage shown is from the assessor. Builders’ plans and the assessor’s measurements are often different. I have tried to pair the square footage with the corresponding floor plan advertised by the builder. This data includes only homes sold by the builder (resales have been omitted).

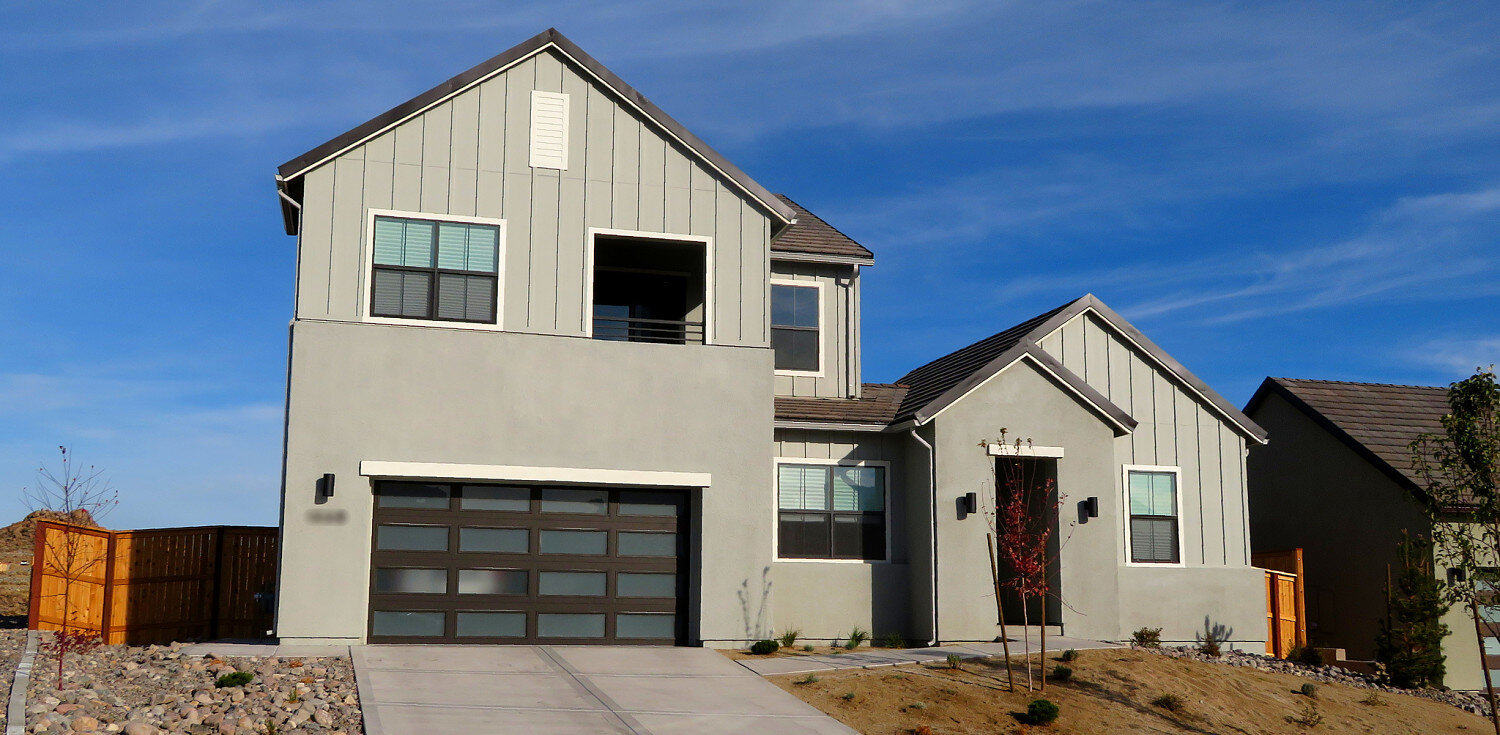
The homes in Symphony Ranch in Reno were built by D.R. Horton. The average sales price of the 43 new construction homes sold in this neighborhood in 2020 was $525,421. The highest sales price was $620,000.

Symphony Ranch
Address Sales Date Sales Price Lot Size
3,264 sq ft
14236 TUSCAN SUN CT 12/22/2020 601,091 0.14
14049 DANCING FLAME CT 12/10/2020 598,664 0.17
14212 TUSCAN SUN CT 09/29/2020 599,995 0.14
14231 TUSCAN SUN CT 09/25/2020 611,375 0.15
14224 TUSCAN SUN CT 09/25/2020 596,465 0.14
14248 TUSCAN SUN CT 09/24/2020 591,275 0.14
14114 GLOWING AMBER CT 09/04/2020 581,465 0.14
3,255 sq ft
14126 GLOWING AMBER CT 05/27/2020 574,995 0.14
14036 DANCING FLAME CT 06/18/2020 609,995 0.14
3,053 sq ft
14025 DANCING FLAME CT 12/29/2020 620,000 0.17
14037 DANCING FLAME CT 11/25/2020 582,072 0.17
14237 TUSCAN SUN CT 11/20/2020 584,715 0.15
14249 TUSCAN SUN CT 11/13/2020 590,975 0.15
14121 GLOWING AMBER CT 09/29/2020 574,995 0.17
14219 TUSCAN SUN CT 09/18/2020 591,323 0.15
14133 GLOWING AMBER CT 05/29/2020 549,995 0.17
2,902 sq ft
14255 TUSCAN SUN CT 12/22/2020 563,892 0.15
14031 DANCING FLAME CT 12/15/2020 575,599 0.17
14243 TUSCAN SUN CT 11/17/2020 563,398 0.15
14225 TUSCAN SUN CT 09/18/2020 554,840 0.15
14115 GLOWING AMBER CT 09/18/2020 552,591 0.17
14213 TUSCAN SUN CT 08/26/2020 559,735 0.15
14127 GLOWING AMBER CT 06/23/2020 529,995 0.17
2,712 sq ft
14230 TUSCAN SUN CT 10/21/2020 530,444 0.14
14242 TUSCAN SUN CT 10/20/2020 519,995 0.14
14218 TUSCAN SUN CT 09/24/2020 520,441 0.14
14254 TUSCAN SUN CT 08/26/2020 531,062 0.14
14120 GLOWING AMBER CT 08/26/2020 528,062 0.14
14132 GLOWING AMBER CT 05/21/2020 531,292 0.14
2,282 sq ft
14042 DANCING FLAME CT 11/24/2020 509,621 0.14
14024 DANCING FLAME CT 10/21/2020 514,146 0.14
2,259 sq ft
14030 DANCING FLAME CT 02/12/2020 539,995 0.14
1,398 sq ft
14100 AMERICAN PILLAR CT 05/08/2020 399,995 0.13
14001 DANCING FLAME CT 01/16/2020 389,995 0.17
1,252 sq ft
14206 TUSCAN SUN CT 07/31/2020 422,031 0.14
14200 TUSCAN SUN CT 07/14/2020 420,000 0.12
14103 GLOWING AMBER CT 06/26/2020 399,995 0.13
14108 GLOWING AMBER CT 06/25/2020 404,995 0.13
14201 TUSCAN SUN CT 06/19/2020 421,008 0.13
14207 TUSCAN SUN CT 06/19/2020 420,000 0.14
14109 GLOWING AMBER CT 05/29/2020 416,413 0.13
14102 GLOWING AMBER CT 03/27/2020 413,409 0.13
14105 AMERICAN PILLAR CT 03/27/2020 400,765 0.20
Symphony Ranch, Reno, Nevada

Symphony Ranch, Reno, Nevada

Make sure that if you visit a new construction sales center--even merely to collect initial information--take Ken or Alicia with you. Visit our website for more information on ongoing new construction projects in Reno-Sparks.

The information herein is based upon data from the Washoe County Assessor's Office for the time period specified. It is deemed reliable but not guaranteed; you are advised to independently assess the accuracy of any information presented.

2020 New Construction Sales Statistics - Ventana at Sierra Shadows

From February 1 through February 7, 2021, I will be posting 2020 sales data for each ongoing new construction subdivision in the Reno/Sparks market. This information is extracted from data published by the Washoe County Assessor. The square footage shown is from the assessor. Builders’ plans and the assessor’s measurements are often different. I have tried to pair the square footage with the corresponding floor plan advertised by the builder. This data includes only homes sold by the builder (resales have been omitted).

The homes in Ventana at Sierra Shadows in Sparks were built by Ryder Homes. The average sales price of the 15 new construction homes sold in this neighborhood in 2020 was $484,048. The highest sales price was $513,492.

Ventana at Sierra Shadows
Address Sales Date Sales Price Lot Size
2,242 sq ft
3014 KALEIDOSCOPE CT 08/06/2020 489,409 0.24
3097 KALEIDOSCOPE CT 07/15/2020 513,492 0.31
3069 KALEIDOSCOPE CT 06/26/2020 492,883 0.21
3038 KALEIDOSCOPE CT 06/26/2020 490,718 0.21
3074 KALEIDOSCOPE CT 05/13/2020 491,124 0.21
3055 KALEIDOSCOPE CT 04/24/2020 486,791 0.21
3031 KALEIDOSCOPE CT 04/02/2020 493,852 0.22
3098 KALEIDOSCOPE CT 02/28/2020 502,656 0.32
2,067 sq ft
3043 KALEIDOSCOPE CT 08/21/2020 473,568 0.21
3089 KALEIDOSCOPE CT 07/10/2020 468,604 0.18
3026 KALEIDOSCOPE CT 07/02/2020 473,245 0.22
3050 KALEIDOSCOPE CT 06/19/2020 479,374 0.21
3077 KALEIDOSCOPE CT 04/30/2020 462,451 0.21
3062 KALEIDOSCOPE CT 03/23/2020 467,663 0.21
3086 KALEIDOSCOPE CT 03/06/2020 474,884 0.19
Ventana at Sierra Shadows, Sparks, Nevada

Ventana at Sierra Shadows, Sparks, Nevada

Make sure that if you visit a new construction sales center--even merely to collect initial information--take Ken or Alicia with you. Visit our website for more information on ongoing new construction projects in Reno-Sparks.

The information herein is based upon data from the Washoe County Assessor's Office for the time period specified. It is deemed reliable but not guaranteed; you are advised to independently assess the accuracy of any information presented.

2020 New Construction Sales Statistics - Falls at West Meadows

From February 1 through February 7, 2021, I will be posting 2020 sales data for each ongoing new construction subdivision in the Reno/Sparks market. This information is extracted from data published by the Washoe County Assessor. The square footage shown is from the assessor. Builders’ plans and the assessor’s measurements are often different. I have tried to pair the square footage with the corresponding floor plan advertised by the builder. This data includes only homes sold by the builder (resales have been omitted).

The homes in the Falls at West Meadows in Verdi were built by D.R. Horton. The average sales price of the 41 new construction homes sold in this neighborhood in 2020 was $513,259. The highest sales price was $634,995.

Falls at West Meadows
Address Sales Date Sales Price Lot Size
3,236 sq ft
8148 DORNOCH DR 07/29/2020 589,995 0.21
213 WILLOWS QUEST DR 03/23/2020 548,995 0.23
10 WILLOWS QUEST CT 03/20/2020 519,995 0.19
40 WILLOWS QUEST CT 01/24/2020 548,995 0.24
3,087 sq ft
209 WILLOWS QUEST DR 03/23/2020 515,995 0.24
221 WILLOWS QUEST DR 03/12/2020 519,995 0.20
45 WILLOWS QUEST CT 02/28/2020 499,995 0.28
30 WILLOWS QUEST CT 01/27/2020 529,995 0.24
2,892 sq ft
205 WILLOWS QUEST DR 04/24/2020 511,995 0.26
208 WILLOWS QUEST DR 03/27/2020 503,000 0.27
20 WILLOWS QUEST CT 02/28/2020 499,995 0.24
2,600 sq ft
434 CHELMSFORD DR 02/14/2020 519,995 0.23
2,560 sq ft
331 WATERVILLE DR 05/15/2020 499,995 0.20
8343 SIMSBURY DR 03/27/2020 524,995 0.25
8390 SIMSBURY DR 03/23/2020 524,995 0.20
8374 SIMSBURY DR 02/21/2020 524,995 0.18
116 CRUDEN BAY CT 01/30/2020 524,995 0.31
8282 FENHOLLOW DR 01/22/2020 634,995 0.21
2,486 sq ft
8294 FENHOLLOW DR 09/21/2020 594,995 0.20
425 CHELMSFORD DR 02/14/2020 519,995 0.23
2,347 sq ft
8377 SIMSBURY DR 05/27/2020 499,995 0.26
8352 ENDSLEY DR 03/31/2020 514,995 0.30
8378 SIMSBURY DR 03/27/2020 504,995 0.18
416 CHELMSFORD DR 03/13/2020 511,995 0.27
8370 SIMSBURY DR 03/04/2020 507,195 0.20
2,034 sq ft
8100 DORNOCH CT 12/02/2020 513,730 0.25
8112 DORNOCH CT 10/27/2020 514,105 0.25
8124 DORNOCH DR 10/20/2020 514,995 0.18
8136 DORNOCH DR 09/23/2020 509,945 0.18
1,820 sq ft
8123 DORNOCH DR 11/17/2020 489,995 0.26
7996 DORNOCH CT 11/06/2020 496,595 0.26
8108 DORNOCH CT 10/29/2020 494,995 0.27
8131 DORNOCH DR 10/23/2020 474,995 0.21
8120 DORNOCH DR 10/22/2020 489,995 0.18
8128 DORNOCH DR 10/14/2020 489,995 0.18
1,620 sq ft
8104 DORNOCH CT 11/12/2020 487,995 0.36
201 WILLOWS QUEST DR 10/28/2020 471,210 0.30
8116 DORNOCH CT 10/26/2020 469,995 0.21
8132 DORNOCH DR 09/28/2020 469,995 0.18
8127 DORNOCH DR 09/25/2020 449,995 0.22
Unknown
8152 DORNOCH DR 12/21/2020 506,995 0.20
Truckee River near the Falls at West Meadows, Verdi, Nevada

Truckee River near the Falls at West Meadows, Verdi, Nevada

Make sure that if you visit a new construction sales center--even merely to collect initial information--take Ken or Alicia with you. Visit our website for more information on ongoing new construction projects in Reno-Sparks.

The information herein is based upon data from the Washoe County Assessor's Office for the time period specified. It is deemed reliable but not guaranteed; you are advised to independently assess the accuracy of any information presented.

2020 New Construction Sales Statistics - Estates at West Meadows

From February 1 through February 7, 2021, I will be posting 2020 sales data for each ongoing new construction subdivision in the Reno/Sparks market. This information is extracted from data published by the Washoe County Assessor. The square footage shown is from the assessor. Builders’ plans and the assessor’s measurements are often different. I have tried to pair the square footage with the corresponding floor plan advertised by the builder. This data includes only homes sold by the builder (resales have been omitted).

The homes in the Estates at West Meadows in Verdi are built by D.R. Horton. The average sales price of the 22 new construction homes sold in this neighborhood in 2020 was $508,754. The highest sales price was $594,995.

Estates at West Meadows
Address Sales Date Sales Price Lot Size
2,791 sq ft
305 WATERVILLE DR 06/19/2020 594,995 0.24
2,688 sq ft
8386 SIMSBURY DR 03/23/2020 540,855 0.18
8339 SIMSBURY DR 02/21/2020 529,995 0.20
2,600 sq ft
8382 SIMSBURY DR 03/20/2020 530,800 0.19
8381 SIMSBURY DR 03/13/2020 530,800 0.32
420 CHELMSFORD DR 01/29/2020 531,995 0.27
8348 ENDSLEY DR 01/24/2020 539,995 0.27
2,560 sq ft
8371 DRUIDS GLEN DR 05/15/2020 520,675 0.21
2,347 sq ft
8331 SIMSBURY DR 02/28/2020 525,000 0.21
2,034 sq ft
8402 SIMSBURY DR 11/24/2020 504,995 0.21
8395 DRUIDS GLEN DR 09/25/2020 511,783 0.17
8387 DRUIDS GLEN DR 08/21/2020 499,995 0.17
1,820 sq ft
8388 DRUIDS GLEN DR 09/30/2020 484,666 0.21
8399 DRUIDS GLEN DR 09/25/2020 481,295 0.17
8379 DRUIDS GLEN DR 09/24/2020 485,000 0.23
1,620 sq ft
8384 DRUIDS GLEN DR 09/17/2020 470,801 0.21
8383 DRUIDS GLEN DR 08/24/2020 459,995 0.18
1,599 sq ft
8391 DRUIDS GLEN DR 09/25/2020 461,210 0.17
Unknown
8403 DRUIDS GLEN DR 12/23/2020 508,995 0.17
8407 DRUIDS GLEN DR 12/22/2020 479,995 0.17
8341 ENDSLEY DR 12/17/2020 512,455 0.20
8345 ENDSLEY DR 12/15/2020 486,295 0.22
Estates at West Meadows, Verdi, Nevada

Estates at West Meadows, Verdi, Nevada

Make sure that if you visit a new construction sales center--even merely to collect initial information--take Ken or Alicia with you. Visit our website for more information on ongoing new construction projects in Reno-Sparks.

The information herein is based upon data from the Washoe County Assessor's Office for the time period specified. It is deemed reliable but not guaranteed; you are advised to independently assess the accuracy of any information presented.

2020 New Construction Sales Statistics - The Pointe at Somersett

From February 1 through February 29, 2021, I will be posting 2020 sales data for each ongoing new construction subdivision in the Reno/Sparks market. This information is extracted from data published by the Washoe County Assessor. The square footage shown is from the assessor. Builders’ plans and the assessor’s measurements are often different. I have tried to pair the square footage with the corresponding floor plan advertised by the builder. This data includes only homes sold by the builder (resales have been omitted).

The homes in the Pointe at Somersett subdivision are built by Ryder Homes. The average sales price of the 25 new construction homes sold in this neighborhood in 2020 was $698,403. The highest sales price was $821,857.

The Pointe at Somersett
Address Sales Date Sales Price Sq Ft Acres
1527 ELK RUN TRL 12/11/2020 $751,660 3,111 0.24
1680 HUNTLEY TRL 08/14/2020 $794,092 3,111 0.25
1618 HUNTLEY TRL 05/28/2020 $780,380 3,111 0.21
8798 LARKHAVEN TRL 04/17/2020 $821,857 3,111 0.34
8773 LARKHAVEN TRL 03/13/2020 $730,535 3,111 0.22
8770 LARKHAVEN TRL 01/31/2020 $677,840 3,111 0.21
1511 ELK RUN TRL 08/28/2020 $711,792 2,569 0.31
1676 HUNTLEY TRL 07/17/2020 $726,225 2,569 0.22
1622 HUNTLEY TRL 06/26/2020 $654,810 2,569 0.23
1670 HUNTLEY TRL 06/19/2020 $768,727 2,569 0.27
1628 HUNTLEY TRL 06/08/2020 $668,243 2,569 0.21
1612 HUNTLEY TRL 05/11/2020 $742,091 2,569 0.21
1601 HUNTLEY TRL 04/10/2020 $722,000 2,569 0.34
8790 LARKHAVEN TRL 03/30/2020 $707,908 2,569 0.31
8759 LARKHAVEN TRL 02/25/2020 $634,900 2,569 0.26
8780 LARKHAVEN TRL 02/14/2020 $680,490 2,569 0.21
8768 LARKHAVEN TRL 01/10/2020 $660,378 2,569 0.21
8779 LARKHAVEN TRL 12/11/2020 $624,885 2,380 0.22
1523 ELK RUN TRL 11/20/2020 $632,108 2,380 0.23
1674 HUNTLEY TRL 06/26/2020 $697,731 2,380 0.22
8769 LARKHAVEN TRL 04/06/2020 $601,000 2,380 0.22
8763 LARKHAVEN TRL 03/26/2020 $599,900 2,380 0.22
8788 LARKHAVEN TRL 03/20/2020 $660,663 2,380 0.24
8778 LARKHAVEN TRL 02/07/2020 $590,160 2,380 0.21
1679 HUNTLEY TRL 12/21/2020 $819,691 0.22
The Pointe 3_opt.jpg

Make sure that if you visit a new construction sales center--even merely to collect initial information--take Ken or Alicia with you. Visit our website for more information on ongoing new construction projects in Reno-Sparks.

The information herein is based upon data from the Washoe County Assessor's Office for the time period specified. It is deemed reliable but not guaranteed; you are advised to independently assess the accuracy of any information presented.

2020 New Construction Sales Statistics - Whispering Canyon at Caughlin Ranch

In February, 2021, I will be posting 2020 sales data for each ongoing new construction subdivision in the Reno/Sparks market. This information is extracted from data published by the Washoe County Assessor. The square footage shown is from the assessor. Builders’ plans and the assessor’s measurements are often different. I have tried to pair the square footage with the corresponding floor plan advertised by the builder. This data includes only homes sold by the builder (resales have been omitted).

The homes in the Whispering Canyon at Caughlin Ranch subdivision were built by Tim Lewis Communities. The average sales price of the 20 new construction homes sold in this neighborhood in 2020 was $983,522. The highest sales price was $1,325,979.

Whispering Canyon at Caughlin Ranch
Address Sales Date Sales Price Sq Ft Acres
3654 PINOT GRIGIO DR 12/28/2020 $1,325,979 4,186 0.24
609 PINOT NOIR CT 12/08/2020 $1,058,065 4,186 0.24
3671 PINOT GRIGIO DR 11/24/2020 $1,027,790 4,186 0.27
3631 PINOT GRIGIO DR 09/11/2020 $943,915 4,186 0.24
617 PINOT NOIR CT 09/01/2020 $1,001,735 4,186 0.29
3624 PINOT GRIGIO DR 04/10/2020 $1,000,000 4,186 0.23
3531 PINOT NOIR DR 02/27/2020 $899,900 4,186 0.25
3674 PINOT GRIGIO DR 12/18/2020 $1,146,764 3,360 0.28
3644 PINOT GRIGIO DR 10/29/2020 $967,733 3,360 0.24
605 PINOT NOIR CT 09/18/2020 $1,066,479 3,360 0.24
613 PINOT NOIR CT 09/15/2020 $932,183 3,360 0.24
3501 PINOT NOIR DR 07/07/2020 $870,000 3,360 0.25
3621 PINOT GRIGIO DR 03/31/2020 $933,443 3,360 0.24
601 PINOT NOIR CT 10/02/2020 $1,009,675 3,046 0.24
3611 PINOT NOIR DR 12/16/2020 $904,701 2,820 0.22
3664 PINOT GRIGIO DR 11/20/2020 $1,056,128 2,820 0.25
3641 PINOT GRIGIO DR 09/17/2020 $840,467 2,820 0.24
3634 PINOT GRIGIO DR 04/29/2020 $886,383 2,820 0.23
522 PINOT GRIGIO CT 02/28/2020 $874,440 2,820 0.21
3684 PINOT GRIGIO DR 12/16/2020 $924,659 0.26
Whispering+Canyon_opt.jpg

Make sure that if you visit a new construction sales center--even merely to collect initial information--take Ken or Alicia with you. Visit our website for more information on ongoing new construction projects in Reno-Sparks.

The information herein is based upon data from the Washoe County Assessor's Office for the time period specified. It is deemed reliable but not guaranteed; you are advised to independently assess the accuracy of any information presented.

2020 New Construction Sales Statistics - Heartwood Estates

From February 1 through February 7, 2021, I will be posting 2020 sales data for each ongoing new construction subdivision in the Reno/Sparks market. This information is extracted from data published by the Washoe County Assessor. The square footage shown is from the assessor. Builders’ plans and the assessor’s measurements are often different. I have tried to pair the square footage with the corresponding floor plan advertised by the builder. This data includes only homes sold by the builder (resales have been omitted).

The homes in Heartwood Estates in Wingfield Springs were built by Discovery Homes (Seeno Homes). The average sales price of the new construction homes sold in Heartwood Estates in 2020 was $448,825. The highest sales price was $558,595.

Heartwood Estates
Address Sales Date Sales Price Lot Size
Elder (2,684 sq ft)
6591 ANGELS ORCHARD DR 09/28/2020 488,000 0.12
6599 ANGELS ORCHARD DR 08/05/2020 482,730 0.12
6587 ANGELS ORCHARD DR 06/24/2020 554,055 0.09
3104 HEATHER FLUME LN 05/27/2020 443,345 0.12
3116 HEATHER FLUME LN 04/16/2020 436,841 0.11
3112 HEATHER FLUME LN 04/07/2020 493,384 0.12
6574 ANGELS ORCHARD DR 03/16/2020 445,000 0.11
3047 VELVET TRACE LN 02/10/2020 452,620 0.10
Fern (2,673 sq ft)
6595 ANGELS ORCHARD DR 07/28/2020 558,595 0.18
6581 ANGELS ORCHARD DR 07/17/2020 496,016 0.09
6585 ANGELS ORCHARD DR 05/29/2020 575,000 0.09
6584 ANGELS ORCHARD DR 05/19/2020 489,073 0.11
6571 ANGELS ORCHARD DR 01/10/2020 446,250 0.09
Burnet (1,800 sq ft)
3037 VELVET TRACE LN 08/19/2020 415,000 0.14
6577 ANGELS ORCHARD DR 07/31/2020 405,110 0.09
6582 ANGELS ORCHARD DR 07/29/2020 422,120 0.12
3120 HEATHER FLUME LN 06/12/2020 425,938 0.10
6586 ANGELS ORCHARD DR 05/12/2020 437,520 0.13
3123 HEATHER FLUME LN 03/10/2020 415,623 0.10
Arrowleaf (1,702 sq ft)
6583 ANGELS ORCHARD DR 10/13/2020 470,000 0.09
6579 ANGELS ORCHARD DR 06/29/2020 429,710 0.09
6578 ANGELS ORCHARD DR 06/04/2020 394,840 0.17
6575 ANGELS ORCHARD DR 04/28/2020 405,000 0.09
3108 HEATHER FLUME LN 04/10/2020 387,166 0.12
3124 HEATHER FLUME LN 02/28/2020 399,950 0.09
3119 HEATHER FLUME LN 01/24/2020 411,910 0.14
3067 VELVET TRACE LN 01/22/2020 380,000 0.09
6572 ANGELS ORCHARD DR 01/03/2020 406,300 0.10
Heartwood Estates, Wingfield Springs, Sparks, Nevada

Heartwood Estates, Wingfield Springs, Sparks, Nevada

Make sure that if you visit a new construction sales center--even merely to collect initial information--take Ken or Alicia with you. Visit our website for more information on ongoing new construction projects in Reno-Sparks.

The information herein is based upon data from the Washoe County Assessor's Office for the time period specified. It is deemed reliable but not guaranteed; you are advised to independently assess the accuracy of any information presented.

2020 New Construction Sales Statistics - Estates at Mystic Mountain

In February, 2021, I will be posting 2020 sales data for each ongoing new construction subdivision in the Reno/Sparks market. This information is extracted from data published by the Washoe County Assessor. The square footage shown is from the assessor. Builders’ plans and the assessor’s measurements are often different. I have tried to pair the square footage with the corresponding floor plan advertised by the builder. This data includes only homes sold by the builder (resales have been omitted).

The homes in the Estates at Mystic Mountain subdivision are built by Artisan Communities. The average sales price of the 5 new construction homes sold in this neighborhood in 2020 was $828,723. The highest sales price was $1,078,739.

The Estates at Mystic Mountain
Address Sales Date Sales Price Sq Ft Lot Size
115 WILLOW BLUFF CT 12/23/2020 $1,078,739 4,597 0.88
100 WILLOW BLUFF CT 12/04/2020 $757,101 3,591 0.83
120 WILLOW BLUFF CT 11/19/2020 $892,541 3,901 0.81
125 WILLOW BLUFF CT 10/29/2020 $728,480 3,244 0.82
250 PEBBLE CREEK DR 09/03/2020 $686,752 3,062 0.85
Pebble+Creek_opt.jpg

Make sure that if you visit a new construction sales center--even merely to collect initial information--take Ken or Alicia with you. Visit our website for more information on ongoing new construction projects in Reno-Sparks.

The information herein is based upon data from the Washoe County Assessor's Office for the time period specified. It is deemed reliable but not guaranteed; you are advised to independently assess the accuracy of any information presented.

2020 New Construction Sales Statistics - Mallard Crossing

In February, 2021, I will be posting 2020 sales data for each ongoing new construction subdivision in the Reno/Sparks market. This information is extracted from data published by the Washoe County Assessor. The square footage shown is from the assessor. Builders’ plans and the assessor’s measurements are often different. I have tried to pair the square footage with the corresponding floor plan advertised by the builder. This data includes only homes sold by the builder (resales have been omitted).

The homes in the Mallard Crossing subdivision are built by Desert Wind Homes. The average sales price of the 8 new construction homes sold in this neighborhood in 2020 was $444,239. The highest sales price was $461,870.

Mallard Crossing
Address Sales Date Sales Price Sq Ft Lot Size
2810 GREEN HEAD CT 03/06/2020 $448,232 2,159 0.03
2808 GREEN HEAD CT 01/29/2020 $461,870 2,143 0.04
2806 GREEN HEAD CT 01/31/2020 $435,940 2,036 0.03
2804 GREEN HEAD CT 01/07/2020 $451,169 2,036 0.03
2802 GREEN HEAD CT 01/03/2020 $455,147 2,036 0.03
2820 GREEN HEAD CT 02/14/2020 $445,514 1,840 0.03
2822 GREEN HEAD CT 02/13/2020 $429,192 1,840 0.03
2818 GREEN HEAD CT 01/03/2020 $426,848 1,840 0.03
Mallard+Crossing_opt.jpg

Make sure that if you visit a new construction sales center--even merely to collect initial information--take Ken or Alicia with you. Visit our website for more information on ongoing new construction projects in Reno-Sparks.

The information herein is based upon data from the Washoe County Assessor's Office for the time period specified. It is deemed reliable but not guaranteed; you are advised to independently assess the accuracy of any information presented.

2020 New Construction Sales Statistics - Bonde Farms

In February, 2021, I will be posting 2020 sales data for each ongoing new construction subdivision in the Reno/Sparks market. This information is extracted from data published by the Washoe County Assessor. The square footage shown is from the assessor. Builders’ plans and the assessor’s measurements are often different. I have tried to pair the square footage with the corresponding floor plan advertised by the builder. This data includes only homes sold by the builder (resales have been omitted).

The homes in the Bonde Farms subdivision are built by TRC Communities. The average sales price of the 2 new construction homes sold in this neighborhood in 2020 was $752,750. The highest sales price was $820,000.

Bonde Farms
Address Sales Date Sales Price Sq Ft Acres
6412 BONDE FARMS LN 08/17/2020 $820,000 2,531 0.31
6418 BONDE FARMS LN 03/12/2020 $685,500 2,243 0.15
Bonde+Farm_opt.jpg

Make sure that if you visit a new construction sales center--even merely to collect initial information--take Ken or Alicia with you. Visit our website for more information on ongoing new construction projects in Reno-Sparks.

The information herein is based upon data from the Washoe County Assessor's Office for the time period specified. It is deemed reliable but not guaranteed; you are advised to independently assess the accuracy of any information presented.

2020 New Construction Sales Statistics - Hillbrow at Somersett

In February, 2021, I will be posting 2020 sales data for each ongoing new construction subdivision in the Reno/Sparks market. This information is extracted from data published by the Washoe County Assessor. The square footage shown is from the assessor. Builders’ plans and the assessor’s measurements are often different. I have tried to pair the square footage with the corresponding floor plan advertised by the builder. This data includes only homes sold by the builder (resales have been omitted).

The homes in the Hillbrow at Somersett subdivision are built by Preston Homes. The average sales price of the 4 new construction homes sold in this neighborhood in 2020 was $675,750. The highest sales price was $785,000.

Hillbrow at Somersett
Address Sales Date Sales Price Sq Ft Lot Size
1551 ELK RUN TRL 03/04/2020 $785,000 3,352 0.19
1575 ELK RUN TRL 10/26/2020 $725,000 2,765 0.16
1555 ELK RUN TRL 07/13/2020 $560,000 2,582 0.16
1571 ELK RUN TRL 05/15/2020 $633,000 2,515 0.15
Hillbrow_opt.jpg

Make sure that if you visit a new construction sales center--even merely to collect initial information--take Ken or Alicia with you. Visit our website for more information on ongoing new construction projects in Reno-Sparks.

The information herein is based upon data from the Washoe County Assessor's Office for the time period specified. It is deemed reliable but not guaranteed; you are advised to independently assess the accuracy of any information presented.

2020 New Construction Sales Statistics - Woodland Village

From January 25 through February 1, 2021, I will be posting 2020 sales data for each ongoing new construction subdivision in the Reno/Sparks market. This information is extracted from data published by the Washoe County Assessor. The square footage shown is from the assessor. Builders’ plans and the assessor’s measurements are often different. I have tried to pair the square footage with the corresponding floor plan advertised by the builder. This data includes only homes sold by the builder (resales have been omitted).

The homes in Woodland Village in Cold Springs are built by Lifestyle Homes. The average sales price of the 65 new construction homes sold in Woodland Village in 2020 was $365,741. The highest sales price was $430,588.

Woodland Village
Address Sales Date Sales Price Lot Size
2,772 sq ft
18722 TRAIL CANYON CT 12/17/2020 414,666 0.16
18820 TRINITY RANGE CT 06/19/2020 412,190 0.25
920 ORR VALLEY CT 05/11/2020 415,530 0.30
935 ORR VALLEY CT 05/08/2020 415,000 0.24
810 TOHAKUM CT 03/25/2020 410,245 0.36
825 TOHAKUM CT 02/18/2020 414,000 0.35
18756 GRAY HILLS CT 01/31/2020 410,705 0.29
2,304 sq ft
18729 TRAIL CANYON CT 12/02/2020 398,481 0.20
18808 TRINITY RANGE CT 07/01/2020 385,410 0.20
905 ORR VALLEY CT 05/29/2020 382,250 0.27
18749 GRAY HILLS CT 04/24/2020 405,330 0.20
18769 GRAY HILLS CT 04/22/2020 391,395 0.28
18764 GRAY HILLS CT 01/29/2020 399,689 0.28
2,288 sq ft
18824 TRINITY RANGE CT 06/12/2020 404,907 0.23
18760 GRAY HILLS CT 05/13/2020 376,950 0.28
18765 GRAY HILLS CT 03/27/2020 377,660 0.22
2,112 sq ft
18828 TRINITY RANGE CT 08/07/2020 369,400 0.20
1,977 sq ft
18812 TRINITY RANGE CT 06/24/2020 363,255 0.26
900 ORR VALLEY CT 06/23/2020 350,950 0.25
18832 TRINITY RANGE CT 06/05/2020 374,767 0.28
18761 GRAY HILLS CT 05/12/2020 369,991 0.24
18753 GRAY HILLS CT 03/11/2020 406,084 0.30
1,735 sq ft
18754 RYE PATCH CT 10/21/2020 368,120 0.23
1,720 sq ft
18744 MARYS RIVER CT 11/23/2020 343,950 0.15
18758 RYE PATCH CT 10/16/2020 357,228 0.30
18757 GRAY HILLS CT 06/03/2020 340,000 0.27
915 ORR VALLEY CT 04/24/2020 341,551 0.20
18768 GRAY HILLS CT 03/13/2020 349,662 0.29
18741 JONES CREEK CT 02/21/2020 345,603 0.20
18726 JONES CREEK CT 01/30/2020 342,055 0.22
1,570 sq ft
18733 TRAIL CANYON CT 12/23/2020 353,532 0.21
18726 TRAIL CANYON CT 12/09/2020 349,357 0.17
18717 JONES CREEK CT 03/13/2020 342,307 0.22
1,564 sq ft
18725 TRAIL CANYON CT 12/11/2020 330,691 0.19
945 ORR VALLEY CT 05/15/2020 322,612 0.21
925 ORR VALLEY CT 05/05/2020 336,834 0.18
18748 GRAY HILLS CT 04/01/2020 321,858 0.26
18752 GRAY HILLS CT 03/25/2020 306,415 0.22
18723 JONES CREEK CT 03/02/2020 315,775 0.24
18745 GRAY HILLS CT 02/21/2020 318,954 0.19
18740 GRAY HILLS CT 02/14/2020 311,195 0.21
1,428 sq ft
910 ORR VALLEY CT 04/15/2020 316,556 0.30
18744 GRAY HILLS CT 02/12/2020 309,859 0.22
Unknown Sq Ft
18741 MARYS RIVER CT 11/20/2020 416,883 0.37
18740 MARYS RIVER CT 11/13/2020 411,925 0.22
18749 MARYS RIVER CT 11/06/2020 342,822 0.28
18748 MARYS RIVER CT 10/29/2020 347,446 0.24
18745 MARYS RIVER CT 10/28/2020 341,471 0.22
18755 RYE PATCH CT 10/14/2020 402,428 0.33
18753 RYE PATCH CT 10/08/2020 390,647 0.49
18759 RYE PATCH CT 10/01/2020 366,075 0.32
NOT SUPPLIED 09/23/2020 408,717 0.44
18817 TRINITY RANGE CT 09/11/2020 416,725 0.25
18833 TRINITY RANGE CT 09/09/2020 345,835 0.25
18829 TRINITY RANGE CT 08/26/2020 430,588 0.26
18825 TRINITY RANGE CT 08/19/2020 380,177 0.25
18821 TRINITY RANGE CT 08/12/2020 362,977 0.27
18813 TRINITY RANGE CT 08/05/2020 391,195 0.26
18805 TRINITY RANGE CT 07/31/2020 339,359 0.22
18816 TRINITY RANGE CT 07/29/2020 374,349 0.22
18809 TRINITY RANGE CT 07/23/2020 353,686 0.22
18801 TRINITY RANGE CT 07/15/2020 356,355 0.28
18800 TRINITY RANGE CT 07/10/2020 313,741 0.20
18804 TRINITY RANGE CT 07/08/2020 308,152 0.19
Woodland Village, Cold Springs, Reno, Nevada

Woodland Village, Cold Springs, Reno, Nevada

Make sure that if you visit a new construction sales center--even merely to collect initial information--take Ken or Alicia with you. Visit our website for more information on ongoing new construction projects in Reno-Sparks.

The information herein is based upon data from the Washoe County Assessor's Office for the time period specified. It is deemed reliable but not guaranteed; you are advised to independently assess the accuracy of any information presented.

2020 New Construction Sales Statistics - Autumn Wood

From January 25 through February 1, 2021, I will be posting 2020 sales data for each ongoing new construction subdivision in the Reno/Sparks market. This information is extracted from data published by the Washoe County Assessor. The square footage shown is from the assessor. Builders’ plans and the assessor’s measurements are often different. I have tried to pair the square footage with the corresponding floor plan advertised by the builder. This data includes only homes sold by the builder (resales have been omitted).

The townhomes in Autumn Wood were built by D.R. Horton. The average sales price of the 38 new construction homes sold in Autumn Wood in 2020 was $345,153. The highest sales price was $372,995.

Autumn Wood
Address Sales Date Sales Price Lot Size
1,475 sq ft
12491 AUTUMN BREEZE CT 12/31/2020 372,995 0.12
12479 AUTUMN BREEZE CT 12/24/2020 372,995 0.09
12467 AUTUMN BREEZE CT 12/23/2020 372,995 0.12
451 AUTUMN BREEZE CIR 11/25/2020 354,995 0.04
459 AUTUMN BREEZE CIR 11/25/2020 349,995 0.04
470 AUTUMN BREEZE CIR 11/13/2020 369,995 0.12
480 AUTUMN BREEZE CIR 11/10/2020 369,995 0.09
486 AUTUMN BREEZE CIR 11/05/2020 369,995 0.09
467 AUTUMN BREEZE CIR 10/01/2020 344,995 0.04
471 AUTUMN BREEZE CIR 09/30/2020 347,290 0.04
483 AUTUMN BREEZE CIR 09/30/2020 339,995 0.04
487 AUTUMN BREEZE CIR 09/30/2020 339,995 0.04
532 AUTUMN BREEZE CIR 07/31/2020 329,995 0.04
504 AUTUMN BREEZE CIR 07/24/2020 329,995 0.04
500 AUTUMN BREEZE CIR 07/20/2020 329,995 0.04
537 AUTUMN BREEZE CIR 07/17/2020 339,995 0.04
533 AUTUMN BREEZE CIR 07/13/2020 339,995 0.04
520 AUTUMN BREEZE CIR 06/26/2020 341,210 0.04
536 AUTUMN BREEZE CIR 06/26/2020 332,290 0.04
516 AUTUMN BREEZE CIR 06/25/2020 339,995 0.04
1,344 sq ft
12473 AUTUMN BREEZE CT 12/23/2020 354,995 0.09
12461 AUTUMN BREEZE CT 12/23/2020 354,995 0.12
12485 AUTUMN BREEZE CT 12/18/2020 354,995 0.12
455 AUTUMN BREEZE CIR 11/25/2020 344,996 0.04
463 AUTUMN BREEZE CIR 11/25/2020 344,995 0.04
462 AUTUMN BREEZE CIR 10/29/2020 357,290 0.10
479 AUTUMN BREEZE CIR 10/16/2020 332,995 0.04
475 AUTUMN BREEZE CIR 09/30/2020 337,995 0.04
492 AUTUMN BREEZE CIR 07/31/2020 345,290 0.04
496 AUTUMN BREEZE CIR 07/31/2020 345,290 0.04
540 AUTUMN BREEZE CIR 07/29/2020 324,995 0.04
544 AUTUMN BREEZE CIR 07/29/2020 324,995 0.04
529 AUTUMN BREEZE CIR 07/27/2020 337,290 0.04
524 AUTUMN BREEZE CIR 07/27/2020 324,995 0.04
508 AUTUMN BREEZE CIR 07/20/2020 329,995 0.04
512 AUTUMN BREEZE CIR 07/15/2020 339,995 0.04
525 AUTUMN BREEZE CIR 06/30/2020 339,995 0.04
528 AUTUMN BREEZE CIR 06/30/2020 329,995 0.04
Autumn Wood by D.R. Horton

Autumn Wood by D.R. Horton

Make sure that if you visit a new construction sales center--even merely to collect initial information--take Ken or Alicia with you. Visit our website for more information on ongoing new construction projects in Reno-Sparks.

The information herein is based upon data from the Washoe County Assessor's Office for the time period specified. It is deemed reliable but not guaranteed; you are advised to independently assess the accuracy of any information presented.

2020 New Construction Sales Statistics - Caramella Ranch - Copper View (Toll Brothers)

From January 25 through February 1, 2021, I will be posting 2020 sales data for each ongoing new construction subdivision in the Reno/Sparks market. This information is extracted from data published by the Washoe County Assessor. The square footage shown is from the assessor. Builders’ plans and the assessor’s measurements are often different. I have tried to pair the square footage with the corresponding floor plan advertised by the builder. This data includes only homes sold by the builder (resales have been omitted).

The homes in Copper View at Caramella Ranch are built by Toll Brothers. The average sales price of the 26 new construction homes sold in Copper View in 2020 was $671,017. The highest sales price was $931,870.

Caramella Ranch - Copper View
Address Sales Date Sales Price Lot Size
3,150 sq ft
3008 COUNTRY WIND LN 09/22/2020 931,870 0.32
Winsley (2,970 sq ft)
15023 COPPER SUNRISE DR 10/29/2020 799,259 0.14
3021 CHESTNUT HILL LN 09/30/2020 682,147 0.15
3035 COUNTRY WIND LN 09/08/2020 732,495 0.14
15058 IRON RIVER DR 07/17/2020 688,995 0.15
15057 IRON RIVER DR 03/30/2020 859,541 0.14
15045 IRON RIVER DR 12/18/2020 824,995 0.14
15019 COPPER SUNRISE DR 11/10/2020 642,102 0.15
3039 COUNTRY WIND LN 10/09/2020 674,995 0.14
3012 COUNTRY WIND LN 09/01/2020 652,225 0.28
15049 IRON RIVER DR 05/27/2020 853,004 0.14
3027 COUNTRY WIND LN 04/16/2020 659,995 0.14
3040 COUNTRY WIND LN 01/08/2020 587,826 0.16
2,803 sq ft
15011 COPPER SUNRISE DR 07/24/2020 600,587 0.14
Addison (2,295 sq ft)
904 IRON RIVER CT 01/24/2020 599,995 0.17
Addison (2,115 sq ft)
15071 COPPER SUNRISE DR 12/30/2020 779,489 0.15
15007 COPPER SUNRISE DR 12/16/2020 638,767 0.14
3024 COUNTRY WIND LN 11/25/2020 622,369 0.16
3043 COUNTRY WIND LN 10/28/2020 654,036 0.14
15015 COPPER SUNRISE DR 06/26/2020 512,710 0.15
15042 IRON RIVER DR 04/30/2020 492,430 0.15
3044 COUNTRY WIND LN 04/28/2020 596,995 0.16
15062 IRON RIVER DR 02/26/2020 535,589 0.15
3031 COUNTRY WIND LN 02/24/2020 625,917 0.14
15053 IRON RIVER DR 01/29/2020 579,663 0.14
15066 IRON RIVER DR 01/28/2020 618,448 0.15
Copper View at Caramella Ranch (Toll Brothers)

Copper View at Caramella Ranch (Toll Brothers)

Make sure that if you visit a new construction sales center--even merely to collect initial information--take Ken or Alicia with you. Visit our website for more information on ongoing new construction projects in Reno-Sparks.

The information herein is based upon data from the Washoe County Assessor's Office for the time period specified. It is deemed reliable but not guaranteed; you are advised to independently assess the accuracy of any information presented.

2020 New Construction Sales Statistics - The Boulders at Somersett

In February, 2021, I am posting 2020 sales data for each ongoing new construction subdivision in the Reno/Sparks market. This information is extracted from data published by the Washoe County Assessor. The square footage shown is from the assessor. Builders’ plans and the assessor’s measurements are often different. I have tried to pair the square footage with the corresponding floor plan advertised by the builder. This data includes only homes sold by the builder (resales have been omitted).

The homes in the Boulders at Somersett subdivision were built by Toll Brothers. The average sales price of the 5 new construction homes sold in this neighborhood in 2020 was $1,216,350. The highest sales price was $1,668,388.

The Boulders at Somersett
Address Sales Date Sales Price Sq Ft Lot Size
1695 BOULDER RIDGE CT 3/20/2020 $1,668,388 5826 1.1
1740 SHARPE HILL CIR 6/23/2020 $1,078,321 5504 1.03
1745 BOULDER RIDGE TRL 12/18/2020 $1,398,790 4506 0.85
1770 SHARPE HILL CIR 10/16/2020 $1,131,253 4506 0.86
1765 BOULDER RIDGE TRL 6/2/2020 $805,000 4506 0.64
Somersett_opt.jpg

Make sure that if you visit a new construction sales center--even merely to collect initial information--take Ken or Alicia with you. Visit our website for more information on ongoing new construction projects in Reno-Sparks.

The information herein is based upon data from the Washoe County Assessor's Office for the time period specified. It is deemed reliable but not guaranteed; you are advised to independently assess the accuracy of any information presented.

2020 New Construction Sales Statistics - The Cliffs at Somersett

In February, 2021, I am posting 2020 sales data for each ongoing new construction subdivision in the Reno/Sparks market. This information is extracted from data published by the Washoe County Assessor. The square footage shown is from the assessor. Builders’ plans and the assessor’s measurements are often different. I have tried to pair the square footage with the corresponding floor plan advertised by the builder. This data includes only homes sold by the builder (resales have been omitted).

The homes in the Cliffs at Somersett subdivision are built by Toll Brothers. The average sales price of the 38 new construction homes sold in this neighborhood in 2020 was $947,641. The highest sales price was $1,325,066.

The Cliffs at Somersett
Address Sales Date Sales Price Lot Size
Montrose (3,145 sq ft)
9013 IRON SKY TRL 12/21/2020 $789,196 0.19
9017 IRON SKY CT 11/17/2020 $660,756 0.20
9191 GRAYCLIFF LN 10/15/2020 $809,995 0.19
9222 WILD SKIES CT 07/31/2020 $1,272,746 0.27
2257 COLD CREEK TRL 07/31/2020 $1,146,066 0.18
9201 GRAYCLIFF LN 05/26/2020 $787,729 0.32
2251 HILLSBOROUGH ST 02/25/2020 $988,650 0.18
2235 HILLSBOROUGH ST 01/23/2020 $847,443 0.19
(3,065 sq ft)
9167 GRAYCLIFF LN 05/06/2020 $734,832 0.20
(3,060 sq ft)
2223 HILLSBOROUGH ST 04/10/2020 $1,306,183 0.25
Viewmont (3,045 sq ft)
9171 GRAYCLIFF LN 12/18/2020 $849,995 0.21
9179 GRAYCLIFF LN 11/12/2020 $807,995 0.20
9005 IRON SKY TRL 10/22/2020 $750,157 0.21
9033 IRON SKY CT 10/14/2020 $896,420 0.27
2237 COLD CREEK TRL 10/02/2020 $1,099,040 0.18
9205 WILD SKIES WAY 09/29/2020 $812,962 0.19
2265 COLD CREEK TRL 09/10/2020 $957,714 0.19
9153 WILD SKIES WAY 08/28/2020 $926,700 0.18
9218 WILD SKIES CT 06/30/2020 $1,056,572 0.20
9219 WILD SKIES CT 06/26/2020 $1,269,994 0.26
9220 WILD SKIES CT 06/18/2020 $1,249,541 0.25
9200 GRAYCLIFF LN 02/28/2020 $991,814 0.22
2231 HILLSBOROUGH ST 02/20/2020 $902,357 0.19
(2,965 sq ft)
2249 COLD CREEK TRL 04/30/2020 $916,677 0.18
2227 HILLSBOROUGH ST 01/31/2020 $833,622 0.20
(2,935 sq ft)
9001 IRON SKY TRL 10/22/2020 $717,912 0.21
Everest (2,820 sq ft)
2233 COLD CREEK TRL 10/27/2020 $1,092,322 0.18
2269 COLD CREEK TRL 10/23/2020 $1,325,066 0.25
9175 GRAYCLIFF LN 10/21/2020 $793,995 0.21
9213 WILD SKIES CT 10/13/2020 $673,258 0.24
9217 WILD SKIES CT 08/20/2020 $1,064,352 0.23
2261 COLD CREEK TRL 08/13/2020 $1,068,141 0.18
2245 COLD CREEK TRL 03/31/2020 $996,132 0.19
2247 HILLSBOROUGH ST 03/10/2020 $972,172 0.18
2255 HILLSBOROUGH ST 01/31/2020 $868,803 0.18
(2,740 sq ft)
2253 COLD CREEK TRL 07/16/2020 $1,051,877 0.18
9163 GRAYCLIFF LN 04/14/2020 $720,807 0.20
2243 HILLSBOROUGH ST 04/02/2020 $1,000,375 0.18
The+Cliffs_opt.jpg

Make sure that if you visit a new construction sales center--even merely to collect initial information--take Ken or Alicia with you. Visit our website for more information on ongoing new construction projects in Reno-Sparks.

The information herein is based upon data from the Washoe County Assessor's Office for the time period specified. It is deemed reliable but not guaranteed; you are advised to independently assess the accuracy of any information presented.

2020 New Construction Sales Statistics - Latigo at Rancharrah

In February, 2021, I am posting 2020 sales data for each ongoing new construction subdivision in the Reno/Sparks market. This information is extracted from data published by the Washoe County Assessor. The square footage shown is from the assessor. Builders’ plans and the assessor’s measurements are often different. I have tried to pair the square footage with the corresponding floor plan advertised by the builder. This data includes only homes sold by the builder (resales have been omitted).

The homes in the Latigo at Rancharrah subdivision are built by Toll Brothers. The average sales price of the 30 new construction homes sold in this neighborhood in 2020 was $1,086,419. The highest sales price was $1,460,875.

Latigo at Rancharrah
Address Sales Date Sales Price Lot Size
(5,037 sq ft)
108 BRIDLEMOOR CT 10/07/2020 $1,063,375 0.17
Kinsey (4,785 sq ft)
106 BRIDLEMOOR CT 10/29/2020 $1,222,559 0.16
723 W PLEASANT OAK TRL 10/15/2020 $1,323,333 0.14
701 W PLEASANT OAK TRL 09/11/2020 $1,460,875 0.16
717 W PLEASANT OAK TRL 03/13/2020 $1,322,199 0.14
(4,777 sq ft)
117 BRIDLEMOOR CT 10/19/2020 $1,386,570 0.27
114 BRIDLEMOOR CT 09/18/2020 $1,065,850 0.27
Allure Elite (4,143 sq ft)
6102 TRIPLE CROWN DR 08/05/2020 $1,322,197 0.21
6101 S PLEASANT OAK TRL 07/31/2020 $1,326,750 0.18
716 W PLEASANT OAK TRL 06/12/2020 $1,266,415 0.17
703 W PLEASANT OAK TRL 04/21/2020 $1,187,337 0.14
Durham (4,124 sq ft)
711 W PLEASANT OAK TRL 09/10/2020 $1,105,995 0.14
727 W PLEASANT OAK TRL 04/28/2020 $1,308,646 0.27
714 W PLEASANT OAK TRL 04/17/2020 $1,092,272 0.17
Allure (2,608 sq ft)
6116 S PLEASANT OAK TRL 12/11/2020 $884,206 0.15
6111 S PLEASANT OAK TRL 11/19/2020 $972,417 0.17
6110 TRIPLE CROWN DR 11/12/2020 $816,183 0.15
721 W PLEASANT OAK TRL 11/05/2020 $1,073,570 0.14
6112 TRIPLE CROWN DR 10/22/2020 $981,900 0.14
110 BRIDLEMOOR CT 09/30/2020 $1,070,558 0.17
709 W PLEASANT OAK TRL 09/25/2020 $1,039,995 0.14
111 BRIDLEMOOR CT 09/08/2020 $892,464 0.14
6104 S PLEASANT OAK TRL 08/18/2020 $991,011 0.15
6108 TRIPLE CROWN DR 07/31/2020 $785,306 0.16
113 BRIDLEMOOR CT 07/27/2020 $855,460 0.14
6102 S PLEASANT OAK TRL 06/26/2020 $996,720 0.15
710 W PLEASANT OAK TRL 04/10/2020 $975,393 0.21
705 W PLEASANT OAK TRL 02/26/2020 $914,204 0.14
6106 S PLEASANT OAK TRL 02/18/2020 $947,168 0.15
725 W PLEASANT OAK TRL 01/03/2020 $941,630 0.14
Latigo_opt.jpg

Make sure that if you visit a new construction sales center--even merely to collect initial information--take Ken or Alicia with you. Visit our website for more information on ongoing new construction projects in Reno-Sparks.

The information herein is based upon data from the Washoe County Assessor's Office for the time period specified. It is deemed reliable but not guaranteed; you are advised to independently assess the accuracy of any information presented.

2020 New Construction Sales Statistics - Regency at Caramella Ranch (Toll Brothers)

From January 25 through February 1, 2021, I will be posting 2020 sales data for each ongoing new construction subdivision in the Reno/Sparks market. This information is extracted from data published by the Washoe County Assessor. The square footage shown is from the assessor. Builders’ plans and the assessor’s measurements are often different. I have tried to pair the square footage with the corresponding floor plan advertised by the builder. This data includes only homes sold by the builder (resales have been omitted).

The homes in Regency at Caramella Ranch are built by Toll Brothers. It is an “active adult” (55+) community. The average sales price of the 69 new construction homes sold in Regency in 2020 was $665,574. The highest sales price was $924,678.

Caramella Ranch - Regency
Address Sales Date Sales Price Lot Size
2,836 sq ft
12092 WAVING WHEAT CT 11/30/2020 867,517 0.30
Windsong (2,748 sq ft)
12071 DESERT CRIMSON LN 12/09/2020 924,678 0.18
12075 DESERT CRIMSON LN 11/24/2020 760,149 0.18
2347 IRON SQUARE DR 09/30/2020 826,847 0.17
2363 IRON SQUARE DR 09/11/2020 644,576 0.18
2409 IVORY SAGE DR 08/28/2020 797,681 0.17
12249 PEWTER POINT ST 04/29/2020 859,461 0.31
2,660 sq ft
12201 PEWTER POINT ST 07/30/2020 847,099 0.21
2,420 sq ft
2306 IRON SQUARE DR 12/22/2020 790,062 0.18
12104 BLACKTAIL CT 07/29/2020 752,382 0.20
12225 PEWTER POINT ST 07/01/2020 718,373 0.20
12246 PEWTER POINT ST 04/15/2020 838,836 0.29
2,262 sq ft
12087 WAVING WHEAT CT 09/30/2020 713,544 0.15
2343 IRON SQUARE DR 08/28/2020 641,204 0.15
2405 IVORY SAGE DR 08/27/2020 653,555 0.15
2413 IVORY SAGE DR 06/30/2020 640,047 0.15
12233 PEWTER POINT ST 04/30/2020 971,258 0.15
Avondale (2,258 sq ft)
2315 IRON SQUARE DR 12/23/2020 719,831 0.16
12099 WAVING WHEAT CT 10/29/2020 631,721 0.18
12226 PEWTER POINT ST 10/02/2020 736,995 0.18
2526 TITANIUM CREST DR 08/14/2020 706,495 0.29
12112 BLACKTAIL CT 07/31/2020 709,609 0.21
12217 PEWTER POINT ST 06/24/2020 726,568 0.20
Yardley (2,203 sq ft)
12119 WAVING WHEAT CT 10/28/2020 697,811 0.29
2538 TITANIUM CREST DR 09/18/2020 659,995 0.29
12241 PEWTER POINT ST 04/30/2020 693,324 0.20
Gramercy (2,006 sq ft)
12507 BLUE STREAM ST 09/25/2020 655,508 0.15
2546 TITANIUM CREST DR 06/30/2020 639,948 0.21
Ascot (2,005 sq ft)
2323 IRON SQUARE DR 12/23/2020 727,995 0.15
2303 IRON SQUARE DR 11/24/2020 628,404 0.14
12098 WAVING WHEAT CT 11/20/2020 725,515 0.24
2354 IRON SQUARE DR 10/29/2020 693,495 0.18
2300 IRON SQUARE DR 10/29/2020 651,177 0.20
2516 TITANIUM CREST DR 09/24/2020 639,995 0.15
2537 TITANIUM CREST DR 07/31/2020 658,748 0.22
2606 STEEL CLOUD CT 07/30/2020 655,263 0.29
12205 PEWTER POINT ST 07/30/2020 549,389 0.17
2417 IVORY SAGE DR 07/14/2020 647,543 0.18
2401 IVORY SAGE DR 06/26/2020 769,518 0.18
12221 PEWTER POINT ST 06/17/2020 675,165 0.19
2534 TITANIUM CREST DR 05/08/2020 629,995 0.21
2531 TITANIUM CREST DR 03/31/2020 727,778 0.21
2523 TITANIUM CREST DR 03/20/2020 602,500 0.17
1,978 sq ft
12094 BLACKTAIL CT 12/23/2020 754,397 0.18
12220 PEWTER POINT ST 08/28/2020 510,439 0.14
2342 IRON SQUARE DR 07/20/2020 696,916 0.14
2542 TITANIUM CREST DR 04/10/2020 570,146 0.25
2517 TITANIUM CREST DR 03/25/2020 588,241 0.16
Aberdeen (1,668 sq ft)
12083 WAVING WHEAT CT 11/20/2020 620,149 0.15
12095 WAVING WHEAT CT 10/29/2020 590,432 0.12
12079 DESERT CRIMSON LN 10/20/2020 660,015 0.16
12097 BLACKTAIL CT 09/18/2020 606,888 0.20
12093 BLACKTAIL CT 08/24/2020 518,553 0.20
12098 BLACKTAIL CT 07/31/2020 654,533 0.15
12109 BLACKTAIL CT 07/31/2020 508,831 0.17
12113 BLACKTAIL CT 07/30/2020 576,827 0.15
12229 PEWTER POINT ST 04/30/2020 545,995 0.15
2610 STEEL CLOUD CT 04/24/2020 550,995 0.18
2530 TITANIUM CREST DR 03/27/2020 581,125 0.19
2511 TITANIUM CREST DR 03/26/2020 424,995 0.15
2510 TITANIUM CREST DR 03/19/2020 576,704 0.14
Cambria (1,663 sq ft)
2371 IRON SQUARE DR 10/29/2020 522,715 0.12
12116 WAVING WHEAT CT 10/23/2020 609,122 0.21
12101 BLACKTAIL CT 10/22/2020 683,886 0.20
12318 CAVE PRIMROSE LN 10/15/2020 501,941 0.13
2346 IRON SQUARE DR 08/26/2020 579,011 0.16
12237 PEWTER POINT ST 07/09/2020 594,995 0.15
12326 CAVE PRIMROSE LN 05/28/2020 521,084 0.17
2522 TITANIUM CREST DR 03/19/2020 568,150 0.14
Regency at Caramella Ranch (Toll Brothers)

Regency at Caramella Ranch (Toll Brothers)

Make sure that if you visit a new construction sales center--even merely to collect initial information--take Ken or Alicia with you. Visit our website for more information on ongoing new construction projects in Reno-Sparks.

The information herein is based upon data from the Washoe County Assessor's Office for the time period specified. It is deemed reliable but not guaranteed; you are advised to independently assess the accuracy of any information presented.

2020 New Construction Sales Statistics - Caramella Ranch - Edgeworth at Ridgeline (Toll Brothers)

From January 25 through February 1, 2021, I will be posting 2020 sales data for each ongoing new construction subdivision in the Reno/Sparks market. This information is extracted from data published by the Washoe County Assessor. The square footage shown is from the assessor. Builders’ plans and the assessor’s measurements are often different. I have tried to pair the square footage with the corresponding floor plan advertised by the builder. This data includes only homes sold by the builder (resales have been omitted).

The homes in the Edgeworth Collection in Ridgeline at Caramella Ranch are built by Toll Brothers. The average sales price of the 25 new construction homes sold in Edgeworth in 2020 was $758,967. The highest sales price was $877,188.

Caramella Ranch - Ridgeline - Edgeworth Collection
Address Sales Date Sales Price Lot Size
2,955 sq ft
2901 AMETHYST HILLS DR 04/29/2020 858,957 0.25
Sarona (2,836 sq ft)
2953 RUBY DESERT DR 12/11/2020 809,353 0.17
3017 DESERT OLIVE DR 11/24/2020 857,995 0.17
2965 RUBY DESERT DR 10/16/2020 785,431 0.17
2913 AMETHYST HILLS DR 08/07/2020 877,188 0.17
2905 AMETHYST HILLS DR 07/08/2020 766,429 0.20
3004 DESERT OLIVE DR 06/19/2020 750,000 0.17
2977 RUBY DESERT DR 05/29/2020 806,448 0.21
13545 COBALT SKY ST 02/26/2020 621,419 0.20
2981 RUBY DESERT DR 01/22/2020 743,768 0.26
3013 DESERT OLIVE DR 01/10/2020 715,131 0.17
2,751 sq ft
2909 AMETHYST HILLS DR 08/19/2020 854,296 0.17
3001 DESERT OLIVE DR 04/30/2020 771,288 0.34
Halsey (2,679 sq ft)
2916 AMETHYST HILLS DR 10/29/2020 751,995 0.17
3037 DESERT OLIVE DR 10/23/2020 699,203 0.17
2969 RUBY DESERT DR 09/22/2020 821,402 0.17
3041 DESERT OLIVE DR 07/15/2020 695,939 0.17
13525 COBALT SKY ST 03/25/2020 685,995 0.19
3009 DESERT OLIVE DR 01/31/2020 724,723 0.17
Austin (2,509 sq ft)
2917 AMETHYST HILLS DR 11/30/2020 856,000 0.17
2900 AMETHYST HILLS DR 09/30/2020 612,303 0.22
2973 RUBY DESERT DR 07/24/2020 701,329 0.18
13555 COBALT SKY ST 04/17/2020 755,327 0.20
13510 WATER WILLOW ST 01/24/2020 673,225 0.28
13515 COBALT SKY ST 01/24/2020 779,029 0.26
Edgeworth Collection, Ridgeline at Caramella Ranch (Toll Brothers)

Edgeworth Collection, Ridgeline at Caramella Ranch (Toll Brothers)

Make sure that if you visit a new construction sales center--even merely to collect initial information--take Ken or Alicia with you. Visit our website for more information on ongoing new construction projects in Reno-Sparks.

The information herein is based upon data from the Washoe County Assessor's Office for the time period specified. It is deemed reliable but not guaranteed; you are advised to independently assess the accuracy of any information presented.

2020 New Construction Sales Statistics - Caramella Ranch - Sky Meadow at Ridgeline (Toll Brothers)

From January 25 through February 1, 2021, I will be posting 2020 sales data for each ongoing new construction subdivision in the Reno/Sparks market. This information is extracted from data published by the Washoe County Assessor. The square footage shown is from the assessor. Builders’ plans and the assessor’s measurements are often different. I have tried to pair the square footage with the corresponding floor plan advertised by the builder. This data includes only homes sold by the builder (resales have been omitted).

The homes in the Sky Meadow Collection in Ridgeline at Caramella Ranch are built by Toll Brothers. The average sales price of the 29 new construction homes sold in Sky Meadow in 2020 was $980,710. The highest sales price was $1,395,475.

Caramella Ranch - Ridgeline - Sky Meadow Collection
Address Sales Date Sales Price Lot Size
Stratford (4,304 sq ft)
3000 FEATHERTOP DR 11/25/2020 1,395,475 0.36
3055 BRISTOL DR 10/29/2020 1,061,099 0.25
3037 BRISTOL DR 09/17/2020 1,141,224 0.25
3034 COPPER STONE DR 08/19/2020 980,000 0.25
3039 COPPER STONE DR 07/24/2020 1,166,547 0.25
3023 COPPER STONE DR 06/18/2020 1,032,995 0.27
3027 COPPER STONE DR 05/29/2020 1,112,293 0.25
3018 COPPER STONE DR 05/27/2020 778,815 0.24
3000 COPPER STONE DR 05/22/2020 873,461 0.26
2999 COPPER STONE DR 05/18/2020 1,225,012 0.24
2991 COPPER STONE DR 04/08/2020 1,158,379 0.24
2979 COPPER STONE DR 02/18/2020 1,100,242 0.32
2983 COPPER STONE DR 01/30/2020 966,389 0.24
Clairmont (3,805 sq ft)
3008 COPPER STONE DR 10/26/2020 911,160 0.24
3024 BRISTOL DR 09/30/2020 929,388 0.28
3041 BRISTOL DR 08/31/2020 1,074,204 0.25
3035 COPPER STONE DR 07/17/2020 1,127,243 0.25
3043 COPPER STONE DR 06/26/2020 990,682 0.26
2987 COPPER STONE DR 02/10/2020 906,523 0.24
3,471 sq ft
3031 COPPER STONE DR 06/26/2020 815,886 0.25
3014 COPPER STONE DR 03/30/2020 917,985 0.25
Baldwin (3,327 sq ft)
3008 FEATHERTOP DR 12/10/2020 900,205 0.25
3004 COPPER STONE DR 10/29/2020 922,609 0.26
3007 COPPER STONE DR 09/16/2020 898,607 0.24
3026 COPPER STONE DR 07/30/2020 861,389 0.25
3030 COPPER STONE DR 06/26/2020 712,820 0.25
3003 COPPER STONE DR 06/23/2020 794,260 0.24
2995 COPPER STONE DR 04/10/2020 956,366 0.24
3022 COPPER STONE DR 03/13/2020 729,319 0.27
Sky Meadow Collection, Ridgeline at Caramella Ranch (Toll Brothers)

Sky Meadow Collection, Ridgeline at Caramella Ranch (Toll Brothers)

Make sure that if you visit a new construction sales center--even merely to collect initial information--take Ken or Alicia with you. Visit our website for more information on ongoing new construction projects in Reno-Sparks.

The information herein is based upon data from the Washoe County Assessor's Office for the time period specified. It is deemed reliable but not guaranteed; you are advised to independently assess the accuracy of any information presented.